Click to read the full report
Back in 2014 then Everett Mayor Ray Stephenson formed a Structural Deficit Advisory Team of city employees to find ways to decrease spending and increase revenues. Fees were raised on car tabs to pay for road overlay programs, the City increased the business license fee, upped mitigation and development fees and eliminated the bookmobile and lifeguards at Silver Lake.
This year Mayor Cassie Franklin issued a mayoral directive to address the structural deficit in what she termed a significant and sustainable way. The City made changes on the staffing side, reducing 18 positions citywide, for a net reduction of 14.5 positions – a total savings of $1.8 million. Payments to retirement systems were also put off and other cuts were made to bring total budget savings for 2019 to about 5.5 million dollars.
Earlier this year the Everett City Council agreed to funding for a study by BERK Consulting out of Seattle. The Everett Benchmarking Report compared the City of Everett to a specifically-identified list of peer cities including Auburn, Bellingham, Federal Way, Kent, Kirkland, Renton, Spokane Valley, and Yakima.
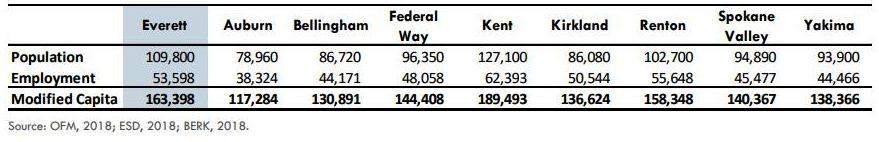
The residential and employment numbers of the cities compared to Everett.
The study points out advantages and disadvantages faced by the City of Everett.
Everett’s Advantages
The City of Everett has a prime location and frontage along Interstate 5 and proximity to Seattle and other major cities and metropolitan areas. This is attractive for retail sales, tourism, and other commercial purposes.
The City of Everett has the highest share of population of traditional workforce ages, with 64% of its population between 20 to 64 years of age.
Everett has more households than almost all the peer communities except for Kent. This is likely due to the fact it has one of the lowest average household sizes at an average of 2.48 people per household.
The City of Everett has one of the highest total jobs of all the peer cities, third to Kent and Renton.
Employment in Everett has grown at a compound average growth rate (CAGR) of 2.02% over the last ten years (2009-2018). This is in the lower end for those peer employment markets that are growing (the Cities of Bellingham, Federal Way, Spokane Valley, and Yakima’s employment markets all declined over the last ten years).
At $100,779 per modified capita, the City of Everett’s assessed valuation is on the high end and significantly higher than many of the peer cities, including the Cities of Auburn, Bellingham, Federal Way, Spokane Valley, and Yakima.
Everett has one of the highest total taxable retail sales among all the peer cities, with almost $20,000 in taxable retail sales per modified capita in 2017. Only Bellingham and Renton had higher taxable retail sales than Everett in 2017.
The City of Everett practices conservative fiscal policy through which it has been able to maintain high credit ratings to assist in obtaining financing at the lowest possible cost. The City’s bond rating, according to Standard & Poor’s, is AA+ for both its general obligation and revenue debt.
Everett’s Disadvantages
While the City of Everett is 7th statewide in terms of population and 9th statewide in terms of land area, the City is only 38th in terms of population density. In many cases it is more costly to provide city services in lower density areas. It is worth noting that the reasons for these differences may differ somewhat – for example, Everett, like the cities of Auburn, Kent, Yakima, and Spokane Valley, has agricultural lands, which have significantly less intensive development than other land uses, within its boundaries.
The City of Everett has noncontiguous boundaries, serving the City proper as well as the Silver Lake neighborhood, an island surrounded by unincorporated Snohomish County. This presents unique service delivery challenges (for example, with zone policing and providing adequate capital facilities to meet citywide level of service standards) and is likely more expensive to serve than if the City’s boundaries were contiguous.
The City of Everett is only 144th in Population Growth over the last ten years (2009 to 2018). This is lower than all the peer cities with an exception of Spokane Valley. City revenue generation is highly dependent on growth, so this could present a long-term revenue generation challenge.
Only 86% of the City of Everett’s population over the age of 25 has a high school diploma or more education. That means that 14% of Everett’s population has less than a high school education.
Everett has one of the lowest household incomes among the peer cities at $52,626 per household. Further, the City of Everett has the lowest household income of the peer cities in the Seattle metropolitan area (all peers except for Bellingham, Spokane Valley, and Yakima). For reference, this is lower than Washington state’s overall median income of $56,835.
Only 43% of resident households in Everett own their own homes. This is the lowest rate of home ownership in peer cities except for Bellingham. While high rates of renter-tenure aren’t necessarily a bad thing, we know that home ownership is predictive of long term and inter-generational financial health for families and that home ownership increases investment in real property.
The City of Everett is on the lower end of its peers in terms of jobs per capita. Bellingham, Federal Way, Kent, Kirkland, and Renton all have more jobs per capita than the City of Everett.
CONCLUSION
The City of Everett is in a challenging financial position and struggles to provide the high-quality urban services its community desires at an overall price it can afford. Due to tax-limiting measures and increases in operating costs that are outpacing revenue growth, the City will need to think broadly about opportunities to reduce its expenses and increase its revenues. Previously, we identified the City’s relative advantages, disadvantages, opportunities, and challenges. Those insights are designed to inform an initial list of measures that the City could take to improve its fiscal balance. However, some of these measures will require more review before being implemented. As such, we’ve recommended, in no particular order, several steps the City might take as it explores these measures:
Because none of the peer cities in the benchmark analysis were from Snohomish County, it may make sense to evaluate whether there are any specific features of the Snohomish County context that contribute to the advantages, disadvantages, opportunities, and/or challenges discussed previously.
We identified that Everett has weaker taxable retail sales for retailing than the peer cities with higher taxable retail sales per modified capita across the major categories. There could be opportunities to strengthen Everett’s retail offerings in some of these areas and increase total taxable retail sales. It may make sense to complete a retail competitiveness and leakage analysis to identify what retailers Everett has a competitive advantage in providing and in what retail categories leakage is occurring, and based on that, develop a strategy for increasing retailing in Everett.
The City should review other cities’ successful property tax levies to identify opportunities to implement additional property taxes, especially for those city services that it governs that might otherwise be governed by other taxing authorities.
The City of Everett only levies and collects transportation impact fees (although, school impact fees are levied and collected within its city boundaries). The City is eligible to levy and collect parks, open space, and recreation facilities and fire protection impact fees and should consider doing so.
The City of Everett’s impact fee rates were set in 2015 and became effective on January 1st, 2016. The City should consider whether, due to the significant economic growth we’ve had over the almost three years since that time, a revised rate study should be completed.
The City of Everett is the only city that governs all four of the following services: fire, library, parks and recreation, and public transit. Unlike many other Washington Cities, the City of Everett has not divested any responsibilities above related to providing services to residents. Many cities have divested their fire services to regional fire authorities, their library services to existing library districts, and their parks and recreation services to metropolitan parks districts. Other cities have also pursued regional solutions to issues such as public transportation or private solutions to providing downtown parking, golf courses, or other amenities. The City should consider carefully which of these services it wants to continue to govern and whether there are opportunities to divest some of these services, while maintaining its tax base and balancing impacts to the quality of services and residents’ tax burdens.
In 2017, the City of Everett spent considerably less on its road/streets program than many of its peers. The City of Everett should consider whether it is investing in its road/streets appropriately, or whether the current level of investment represents an underinvestment in the roadway system that could contribute to deferred maintenance later.
The Cities of Everett, Auburn, Kent, Renton, and Yakima all own public golf courses. Of these cities, Everett is the only one that owns two courses. Unsurprisingly, the City of Everett’s golf spending is, therefore, significantly higher than that of the other cities who provide golf courses. The City should consider the level of service for golf that residents desire and are willing to pay for and adjust its service provision accordingly. It may make sense for the City to evaluate other models for delivering this service to residents.
Despite the fact that the City of Everett is the largest government (in terms of total expenditures) considered, it has one of the lowest total capital expenditures among the governments considered. That means it is investing less into capital assets than many of the other governments and that capital investment is a smaller share of total expenditures than it is elsewhere. The City should review its longterm asset management strategy and capital investment program to determine whether current capital investment and reserves are sufficient to meet future needs, or whether there is a need to develop new policies related to this. (end of conclusion summary)
Again you will want to read the whole study here to get a fuller picture of what the study outlines.
Recently Everett Mayor Cassie Franklin presented a plan for early retirement options that could be offered to about 130 city employees in order to reduce personnel costs. (Emergency service staff are excepted) She has also ordered a review of how the city delivers four major services to taxpayers.
Everett Transit
Parks and Community Services
Everett Fire
Everett Library
The outcome of the study could eventually lead to merging services provided by one or more of the departments with other service providers outside of the city in a regional or shared services model. The city will look at the current model of service, identify potential alternatives, consider the overall costs of changing the way services are provided and report back to the Everett City Council.


December 2, 2018
Everett Government